
Every month, someone in a Lahore office exports sales, stock or payroll data into Excel, spends hours copying columns, fixing dates and pasting totals, and then sends a report that is already out of date. Power Query and Power BI Training in Lahore at Accountech is designed to end that routine. You learn to connect to your data once, clean it with repeatable steps, build a proper data model, write DAX measures and publish interactive dashboards that update when the data changes.
The course follows the real order of reporting work. First you prepare data in Power Query, then you model it with relationships and Power Pivot, then you calculate with DAX, and only then do you visualise in Power BI. That order matters, because a polished chart built on unreliable numbers is worse than no chart at all.
You will need comfortable spreadsheet skills before you start. If your formulas and pivot tables need practice, begin with Advanced Excel training in Lahore or the MS Office course, and see the wider Excel training options across Pakistan if you prefer to compare paths. Once Excel feels natural, Power Query and Power BI are the logical next step.
The following topics are included in your Power Query and Power BI training. Each module builds on the previous one, so you finish with a complete, working reporting workflow rather than a collection of disconnected features.
You start by understanding where each tool fits, then connect to your first data sources and learn to read the Power Query editor.
This module covers the daily cleaning jobs that eat up analysts’ time, done once as repeatable steps instead of by hand each month.
Real data rarely arrives in one tidy table. Here you learn to reshape and combine sources so that analysis becomes easy.
You do not need to become a programmer, but a little M helps you read, adjust and troubleshoot what Power Query generates.
A good model makes every later step simpler. This module teaches you to organise tables the way Power BI expects them.
DAX is the formula language of the data model. You start with simple aggregations and build up to measures that answer real management questions.
Most management reports compare periods. This module shows how to build those comparisons with a proper Date table.
With a trusted model in place, you design the report pages people will actually open.
A dashboard succeeds when a busy manager can read it in half a minute. This module focuses on design choices rather than decoration.
The final module covers what happens after the report is built, including what the free and paid options allow.
Power Query is Microsoft’s data connection and transformation engine, explained in its official overview. It records each cleaning action as a step, so the same sequence runs again whenever the source data is refreshed. The same engine appears inside both Excel and Power BI Desktop, which means the skills you learn carry across both programs.
Power BI is Microsoft’s reporting and visualisation platform; see the Power BI overview for how Power BI Desktop and the online service fit together. In simple terms, Desktop is where you prepare data, model it and design reports, while the service is where finished reports are published and shared.
We teach all of this through business datasets such as sales ledgers, expense sheets, stock movements and customer lists, so you learn each tool in the context of a job it actually does. Typical practice tasks include:
The course scope is Power Query, Power Pivot, DAX and dashboards, taught step by step from beginner level to advanced.

Associate Charted Certified Accountant (ACCA)
Saad Nadeem is described on Udemy as a trainer, ERP consultant and BI specialist, and he teaches with finance and business examples in mind.
A one-month plan that suits working professionals, students and business owners, with lessons you can revisit whenever a topic needs a second look.
Learn on finance and sales style data, so every skill connects to a report you might build at work.
Ask questions and get guidance on WhatsApp 0331-8433334.
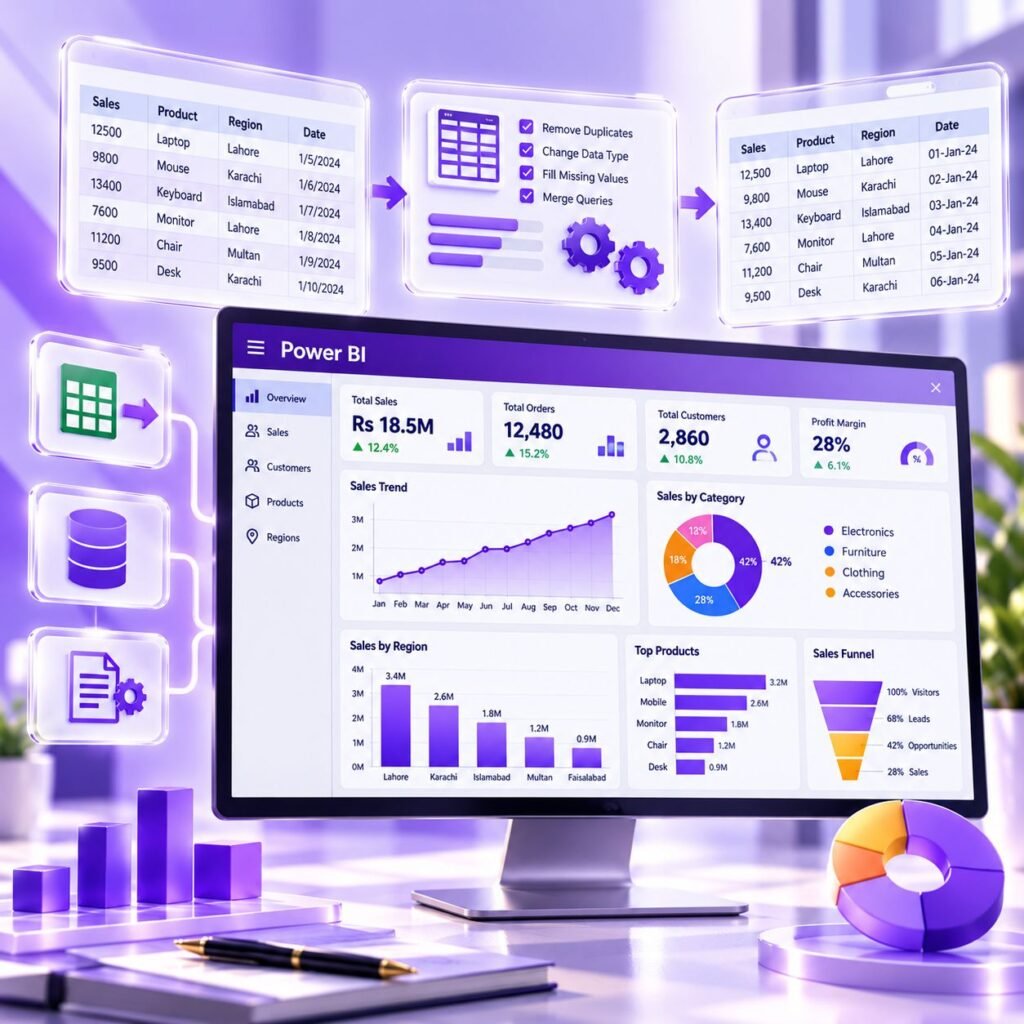
We begin with data preparation because most reporting problems start there. Once your data is clean, modelling and DAX make sense, and dashboards are easier to design. This sequence avoids the common trap of building beautiful visuals on unreliable numbers.
Several things make the course practical rather than theoretical:
Learning these tools reduces manual reporting, improves accuracy and opens doors to analyst roles. Many finance teams now expect staff to combine files and build dashboards without waiting for IT.
Here is what changes in daily work once you can use them well:
These tools do not replace judgement. You still need to know what the numbers mean, and this is why we teach through business scenarios and not just menus.
If you are completely new to spreadsheets, spend a little time on Excel basics first; the course assumes you can already work comfortably with tables and simple formulas.
After your practical training with Accountech Training & Solutions you will be able to:
On completing the course you receive an Accountech certificate of completion, which records that you finished the training. It is issued by Accountech and is not a Microsoft credential.
Microsoft offers its own Power BI certifications through its learning platform, which you can explore separately after this course. Whether or not you pursue one, a portfolio of dashboards is persuasive evidence of skill, because it lets an employer see what you can actually build.
Training record: your certificate of completion from Accountech shows that you studied the full workflow.
Dashboard portfolio: two or three finished dashboards, such as sales, finance and inventory, with a short explanation of each.
Vendor learning: Microsoft Learn paths and documentation show that you keep your knowledge current.
Practical test at work: automating a report your team already produces is often the most convincing proof of all.
Interviewers for reporting and analyst roles often ask you to describe something you have built. A portfolio lets you:
Use sample or anonymised data in anything you show publicly, and never share confidential figures from your employer.
Look for a course that covers data preparation and modelling, not only charts. Many short courses jump straight to visuals, and learners then struggle the first time their own messy file will not load properly.
A good course should also let you practise on realistic business data, give you a way to ask questions after the lesson, and be honest about what it does and does not cover. Accountech also provides Advanced Excel and MS Office training, so you can build the foundation first if you need to. If you are unsure about your level, send a message through the contact page and we will suggest where to begin.
Ask about:
Be cautious of any course that promises a job or a salary; skills help, but results depend on your practice and the market.
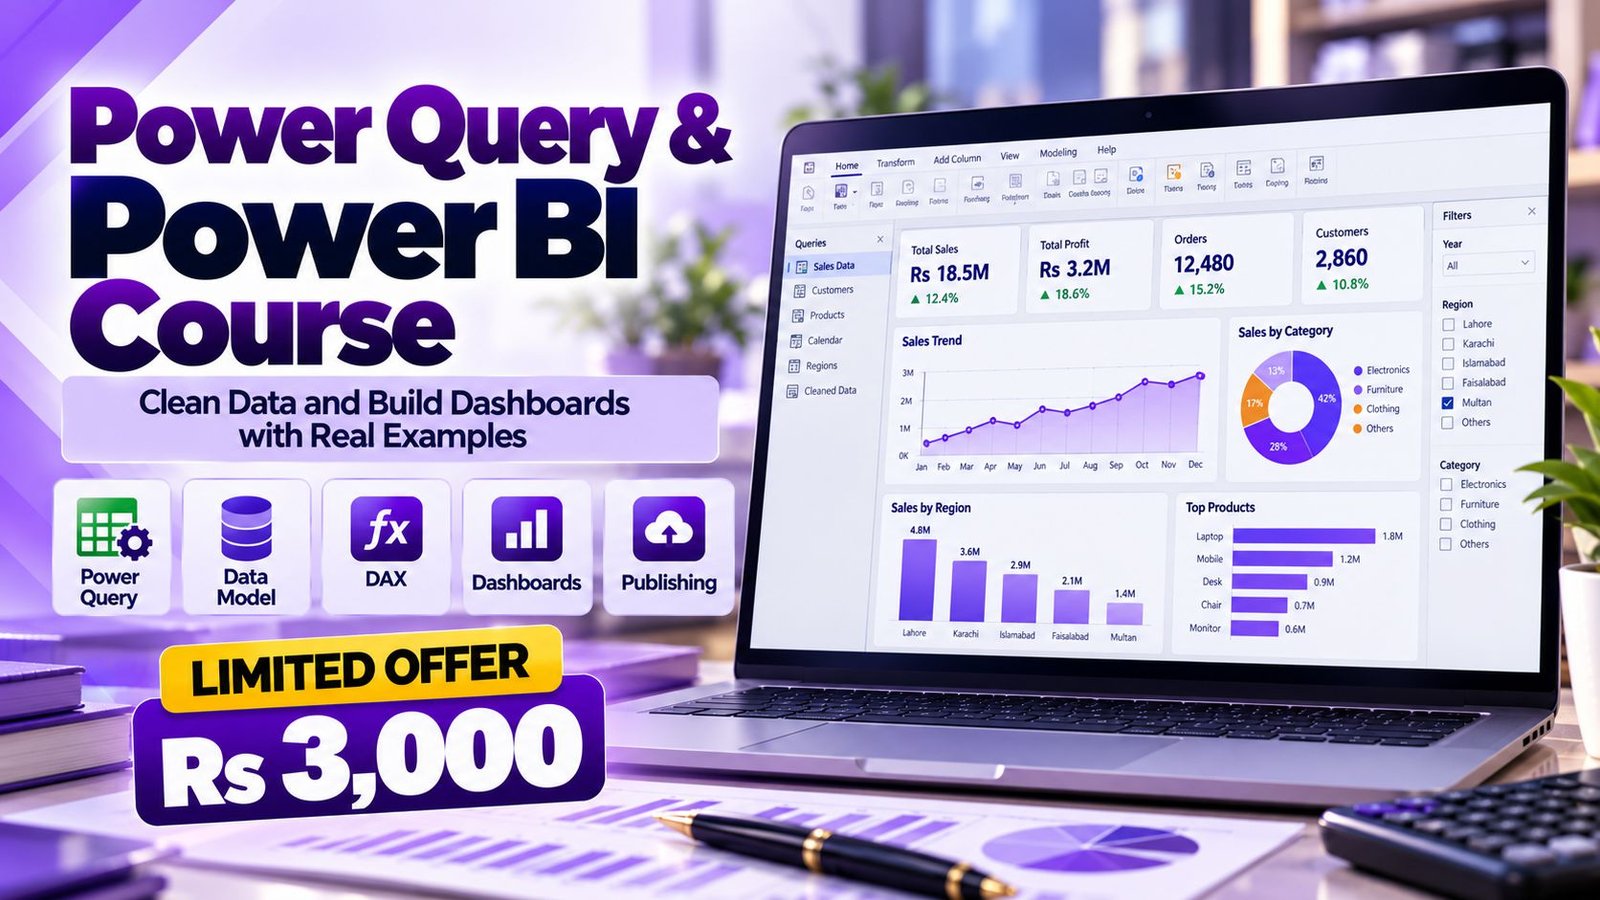
Accountech offers Power Query and Power BI training for Rs 3,000, with a one-month duration. The level runs from beginner to advanced, so you can start with the basics and progress to DAX and dashboards.
Software cost is separate from the course fee. Power BI Desktop is a Windows application that Microsoft lets you download and use for building reports, but sharing reports through the Power BI service depends on the licence you hold; Microsoft explains the options in its licence types documentation. Please check current terms on Microsoft’s site before you plan any team rollout.
To join, use the enrollment page or message us on WhatsApp 0331-8433334 (+92331-8433334). You can also ask about a free demo class first.
Training is online, so you can learn from home or the office anywhere in Lahore without travelling through traffic:
Guided lessons
Follow the full workflow in order, from connecting to data through to a finished dashboard. You can pause, rewind and repeat any topic.
Practice datasets
Work on sales, finance and inventory style files, and build your own dashboard as you progress.
Support
Send questions on WhatsApp 0331-8433334 when you get stuck.
Final project
Bring the modules together in one complete report you can keep in your portfolio.
Because Power BI Desktop runs on Windows, make sure you practise on a Windows computer. A modern laptop with 8 GB of RAM is a comfortable starting point for the practice files. Our office is at 182-Y Block, DHA Phase 3, Lahore, if you wish to enquire in person.
Reporting and analytics skills are used across many job titles. Roles where Power Query and Power BI are commonly mentioned include:
Employers usually look for clean data handling, an understanding of business numbers, clear communication and a few examples of finished work. If you also want accounting depth, our computerized accounting courses pair well with BI skills.
Pay varies widely by employer, experience and city, so check current listings on job sites and use them as a guide rather than a promise.
Power BI is used by organisations worldwide, supporting remote analyst opportunities. Freelance marketplaces and remote job boards regularly list reporting and dashboard tasks, and clients abroad often care more about a working portfolio than a degree.
To compete well, combine Power BI with strong English communication, a solid grasp of business or accounting concepts and, if you wish to go further, a language such as Python; see our Python course in Urdu and Hindi. Check each role’s requirements for deeper skills, and treat this course as a strong foundation rather than a complete qualification.
Lahore’s business landscape gives you many places to apply reporting skills. Banks and financial institutions in Gulberg and the Mall Road area, retail and distribution companies, manufacturing units around Kot Lakhpat and Sundar, textile exporters, hospitals, schools and growing software houses near DHA and Johar Town all rely on timely reports.
Common situations where these skills help include:
If your company wants to train several employees together, see our corporate training options, or contact us to discuss a plan for your team.
The planned duration is one month. Learners who practise a little every day usually finish with time to spare for the final project.
The course fee is Rs 3,000. This covers the training itself; any software or Microsoft licensing costs are separate.
Yes, basic to intermediate Excel is helpful. You should be comfortable with tables, formulas and ideally pivot tables, because Power Query and Power Pivot build on those ideas.
Yes, DAX is part of the course scope along with Power Pivot and dashboards. You learn measures, calculated columns, filter context and common time-intelligence calculations.
Yes, the training is online, and you can ask questions on WhatsApp 0331-8433334. Our office is at 182-Y Block, DHA Phase 3, Lahore if you want to enquire in person.
Power BI Desktop is available from Microsoft as a free download for Windows, so you can practise without buying it. Publishing and sharing through the Power BI service depends on the licence type, so confirm the current terms on Microsoft’s site.
Power BI Desktop is a Windows application, so a Windows laptop or desktop is the practical choice for practice. Check Microsoft’s current documentation if you are considering other setups.
No. Power Query is also available in Excel, where it appears as Get and Transform Data, and the same ideas apply in both. Learning it once helps in either program.
You receive an Accountech certificate of completion. It is not a Microsoft certification; Microsoft’s own exams are separate and can be explored after the course.
Yes, it is a very good fit. Finance professionals already understand ledgers, budgets and ageing reports, so they quickly see how Power BI can automate and improve the reports they already produce.
Practise with your own data after each lesson. Repeating the workflow is the quickest route to confidence. If you have a question that is not answered above, message us on WhatsApp 0331-8433334 or visit the contact page, and we will be happy to help you choose the right starting point.
 Posted on Google
 usama ali
Trustindex verifies that the original source of the review is Google.
This course was good for beginnersPosted on Google Umair IqbalExcellent training experience! The trainer explained everything very clearly, and the session was informative, practical, and easy to understand. This is a very useful basic skill, and I believe everyone should learn it. Highly recommended!Posted on Google
 Waqar AliAccountech Training & solutions offers best practical courses they are really easy and beginners friendly with highly advanced skills and well-traned teachersPosted on Google
 Muhammad TariqBest Accounting material, I gained best knowledge and experience with Accoutech and also received E-certificate.Posted on Google
 Usama AsifI have completed my excel course. According to me, It is very helpful for the professional and highly recommend to all of you to gain your skills and become more competitive for the job marketPosted on Google
 Nasir AyoubI bought the Excel course and it exceeded my expectations. The content and teaching quality were outstanding. I also enrolled in other courses, and all are 5/5. Highly recommended for anyone who wants to learn practical skills.Posted on Google
 Jamshaid Ameer ShahExcellent mode of learning Best Teaching/Guidance 100% RecommendedPosted on Google
 ZA RizwanWith "Accountech Training & Solution" An absolutely wonderful and amazing training experience—truly inspiring and full of valuable learning! 🌟 Thanks Accountech & team.
